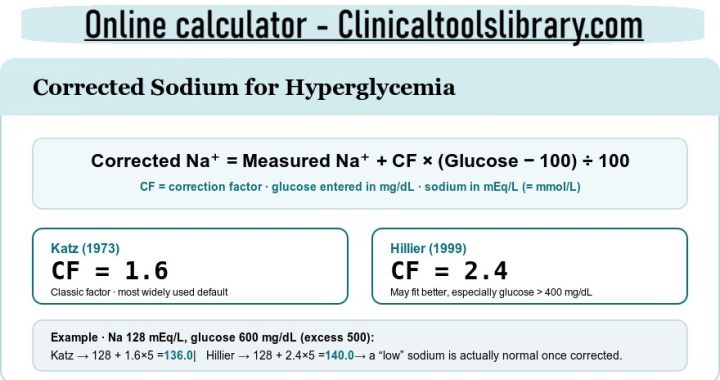
Corrected sodium is the serum sodium value you would expect once the diluting effect of high blood glucose has been removed. In hyperglycemia, glucose pulls water out of cells and into the blood, so the measured sodium can read falsely low. The corrected sodium calculator on this page applies both the Katz (1.6) and Hillier (2.4) correction factors so you can tell true hyponatremia apart from a glucose-driven dilution — a distinction that matters in diabetic ketoacidosis (DKA) and hyperosmolar hyperglycemic state (HHS).
Electrolytes · Endocrine
Corrected Sodium Calculator (for Hyperglycemia)
Estimate the corrected (true) serum sodium when high glucose has diluted the measured value. Uses both the Katz (1.6) and Hillier (2.4) correction factors, with mg/dL and mmol/L support.
Enter lab values
What corrected sodium tells you
In hyperglycemia, the high glucose acts as an effective osmole that pulls water out of cells into the blood. That extra water dilutes the sodium, so the measured serum sodium reads lower than the patient’s true sodium status. The corrected sodium estimates what the sodium would be once that glucose-driven water shift is accounted for.
Dilutional (translocational) hyponatremia vs true pseudohyponatremia
The glucose effect is a real osmotic water shift — often called translocational or dilutional hyponatremia. This is mechanistically different from classic laboratory pseudohyponatremia, which is a measurement artefact caused by very high lipids or proteins and is not corrected by this formula. Many clinicians use “pseudohyponatremia” loosely for the glucose effect; the distinction matters when you interpret a result.
How to read the scale above
- Measured low, corrected normal: the low sodium is largely explained by hyperglycemia. Sodium is expected to rise toward the corrected value as glucose falls with treatment.
- Measured low, corrected still low: a true hyponatremia may co-exist and warrants its own work-up.
- Corrected high: suggests a free-water deficit that the dilution was masking — common in hyperosmolar hyperglycemic state (HHS).
Use in DKA and HHS
Corrected sodium is routinely tracked when interpreting diabetic ketoacidosis (DKA) and hyperosmolar hyperglycemic state (HHS), alongside the glucose trend, serum osmolality, volume status and acid–base balance. A single corrected value should never drive a treatment decision on its own — recheck sodium frequently during fluid and glucose management, because it shifts as glucose normalises.
Corrected sodium formula & equation
Both factors share the same structure — add a fixed amount of sodium for every 100 mg/dL of glucose above the 100 mg/dL reference:
equivalently: + 0.016 × (glucose mg/dL − 100)
equivalently: + 0.024 × (glucose mg/dL − 100)
Why two factors?
Katz derived 1.6 theoretically in 1973 and it became the textbook standard. In 1999, Hillier and colleagues measured the actual sodium fall during controlled hyperglycemia and found the drop was steeper — closer to 2.4 mEq/L per 100 mg/dL — particularly once glucose exceeds about 400 mg/dL. Reporting both lets you see the plausible range rather than treating one estimate as exact.
Units
The classic equations require glucose in mg/dL. If you enter glucose in mmol/L, this tool converts it first (mmol/L × 18.0182 = mg/dL). Sodium in mEq/L and mmol/L is numerically the same value because sodium is monovalent.
Worked example
Measured Na 128 mEq/L, glucose 600 mg/dL → glucose excess = 600−100 = 500.
Katz: 128 + 1.6×(500/100) = 128 + 8.0 = 136.0.
Hillier: 128 + 2.4×(500/100) = 128 + 12.0 = 140.0. A measured value that looked like hyponatremia is actually normal once corrected.
Reference ranges used here
| Parameter | Value | Note |
|---|---|---|
| Normal serum sodium | 135–145 | mEq/L (= mmol/L) |
| Reference glucose | 100 mg/dL | ≈ 5.6 mmol/L; correction starts above this |
| Katz factor | 1.6 | mEq/L Na per 100 mg/dL glucose |
| Hillier factor | 2.4 | mEq/L Na per 100 mg/dL glucose |
| Glucose conversion | ÷ 18.0182 | mg/dL → mmol/L |
Sodium severity bands (corrected value)
| Band | Range (mEq/L) | Label |
|---|---|---|
| Severe low | < 120 | Severe hyponatremia |
| Low | 120–134 | Hyponatremia |
| Normal | 135–145 | Within range |
| High | 146–159 | Hypernatremia |
| Severe high | ≥ 160 | Severe hypernatremia |
Severity bands are a common laboratory convention for orientation only; local laboratory and guideline thresholds vary. Verify against your own laboratory’s reference intervals and current guidance.
Frequently asked questions
What is corrected sodium?
Why correct sodium for hyperglycemia?
Should I use the 1.6 or 2.4 correction factor?
Does hyperglycemia cause hyponatremia?
Is corrected sodium the same as measured sodium?
How do I calculate corrected sodium by hand?
Sources & further reading
- Katz MA. Hyperglycemia-induced hyponatremia — calculation of expected serum sodium depression. N Engl J Med. 1973;289(16):843–844. PMID 4763428.
- Hillier TA, Abbott RD, Barrett EJ. Hyponatremia: evaluating the correction factor for hyperglycemia. Am J Med. 1999;106(4):399–403. PMID 10225241.
- Ing TS, Ganta K, Bhave G, et al. The corrected serum sodium concentration in hyperglycemic crises: computation and clinical applications. Front Med (Lausanne). 2020;7:477. PMID 32984372.
- MDCalc. Sodium Correction for Hyperglycemia — mdcalc.com.
- American Diabetes Association — standards and guidance on hyperglycemic crises (DKA/HHS) for effective osmolality and management context.
Effective serum osmolality shown as an adjunct uses the ADA-style estimate 2×[Na] + glucose(mg/dL)/18 (urea excluded, as it crosses cell membranes freely).
Full disclaimer, limitations & how to report an error
This calculator is an educational reference and clinical decision-aid only. It is not medical advice, not a diagnosis, and not a substitute for the judgement of a qualified healthcare professional. Every output depends entirely on the values you type in; a wrong unit or a typo will produce a wrong result.
The tool computes and informs — it does not recommend a diagnosis, a fluid, a sodium target, or any treatment. The correction formulas are population estimates that assume a uniform osmotic response and may be inaccurate at extreme glucose levels or in critical illness. Corrected sodium must always be interpreted with the glucose trend, osmolality, volume status, acid–base data and the full clinical picture, with sodium rechecked frequently during treatment.
Clinical figures were verified against the primary literature (Katz 1973; Hillier 1999; Ing et al. 2020) and MDCalc. If you believe a value here is wrong, please report it to the site editor. Suspected adverse events involving medicines or devices can be reported to the relevant authority — e.g. the FDA MedWatch program (US) or the MHRA Yellow Card scheme (UK).
What is corrected sodium, and why correct for glucose?
When blood glucose rises, it acts as an effective osmole that draws water from inside cells into the extracellular space. That extra water dilutes the sodium, so the laboratory’s measured sodium understates the patient’s real sodium status. Correcting sodium for glucose estimates what the value would be at a normal glucose, which is why the calculation is often searched for as sodium correction for glucose or adjusted sodium for glucose.
How hyperglycemia lowers measured sodium
The fall in sodium is real, not a laboratory error: the sodium is genuinely more dilute because water has moved into the blood. As glucose is brought down with treatment, water shifts back into cells and the measured sodium rises toward the corrected value. This is why sodium should be rechecked frequently during the management of a hyperglycemic crisis rather than read once.
Translocational hyponatremia vs pseudohyponatremia
The glucose effect is best described as translocational (or dilutional) hyponatremia — a true osmotic water shift. It is mechanistically different from classic laboratory pseudohyponatremia, which is a measurement artefact caused by very high lipids or proteins and is not corrected by this formula. The two are often grouped together in clinical shorthand, but the distinction changes how you interpret the result. The Ing et al. (2020) review in Frontiers in Medicine discusses the underlying physiology in detail.
Corrected sodium formula: Katz (1.6) vs Hillier (2.4)
Both versions of the corrected sodium formula share the same structure — add a fixed amount of sodium for every 100 mg/dL of glucose above the 100 mg/dL reference. They differ only in the correction factor.
Katz formula (1.6 correction factor)
Corrected Na = Measured Na + 1.6 × [(glucose mg/dL − 100) ÷ 100]
Murray Katz derived this factor in 1973. It became the textbook default and is still the most widely used in everyday practice. See the original paper, Katz, N Engl J Med 1973.
Hillier formula (2.4 correction factor)
Corrected Na = Measured Na + 2.4 × [(glucose mg/dL − 100) ÷ 100]
In 1999, Hillier and colleagues measured the actual sodium fall during controlled hyperglycemia in healthy volunteers and found the drop was steeper — a mean of about 2.4 mEq/L per 100 mg/dL, and steeper still once glucose exceeded roughly 400 mg/dL. The study is summarised in Hillier et al., Am J Med 1999.
| Formula | Correction factor | Source | Typically applied when |
|---|---|---|---|
| Katz | 1.6 mEq/L per 100 mg/dL | 1973, NEJM | General use; the long-standing default factor |
| Hillier | 2.4 mEq/L per 100 mg/dL | 1999, Am J Med | Higher glucose (>400 mg/dL); based on measured data |
How to calculate corrected sodium by hand
Take the measured sodium and add the factor multiplied by the glucose excess expressed in hundreds of mg/dL. For a measured sodium of 128 mEq/L and glucose of 600 mg/dL, the excess is 500, so the Katz adjustment is 1.6 × 5 = 8 mEq/L, giving a corrected sodium of 136.0 mEq/L. With the Hillier factor it is 2.4 × 5 = 12 mEq/L, giving 140.0 mEq/L. A value that looked like hyponatremia is in fact normal once corrected.
Units: mg/dL and mmol/L
The classic equations require glucose in mg/dL. If your laboratory reports glucose in mmol/L, convert first (mmol/L × 18 ≈ mg/dL) — the calculator does this automatically. Sodium in mEq/L and mmol/L is numerically the same value because sodium is monovalent.
Corrected sodium in DKA, HHS, and pseudohyponatremia
Corrected sodium is routinely tracked when interpreting hyperglycemic crises, alongside the glucose trend, serum osmolality, volume status and acid–base balance. It helps answer a single practical question: once you account for glucose, is the sodium actually low, normal, or high?
Sodium correction in DKA
In diabetic ketoacidosis the measured sodium is often low because of marked hyperglycemia. A corrected sodium that returns to normal suggests the low reading was largely dilutional, whereas a corrected value that stays low points to a co-existing sodium problem. The American Academy of Family Physicians review on hyponatremia covers the broader diagnostic approach.
Hyperosmolar hyperglycemic state (HHS)
In HHS, glucose can be extremely high and the free-water deficit large. A corrected sodium that comes out elevated signals a water deficit the dilution was masking. Because the relationship between sodium and glucose is not perfectly linear at very high glucose, treat any single corrected value as an estimate and recheck often.
When corrected sodium reveals true hyponatremia
If the corrected sodium remains below 135 mEq/L, a genuine hyponatremia may be present and deserves its own work-up rather than being dismissed as “just the glucose.” Unmasking true hyponatremia this way is one of the most useful things the correction does.
How to use the corrected sodium calculator
Enter the measured serum sodium and the serum glucose, choose your units, and pick a correction factor (or show both). The corrected sodium calculator returns the adjusted value, classifies it against the normal range, and shows the worked calculation so you can check it. You can compare it with our serum osmolality calculator and, when planning correction rates, the sodium correction rate calculator.
Interpreting your result
A measured value in the low range that corrects to normal usually reflects the glucose effect; expect sodium to rise as glucose falls. A corrected value that is still low suggests true hyponatremia, and a corrected value that is high suggests a free-water deficit. None of these should drive treatment on its own — interpret them with the full clinical picture and current guidance. For free-water replacement planning, see the free water deficit calculator.
Sodium reference ranges
| Band | Corrected Na (mEq/L) | Interpretation |
|---|---|---|
| Severe low | < 120 | Severe hyponatremia |
| Low | 120–134 | Hyponatremia |
| Normal | 135–145 | Within range |
| High | 146–159 | Hypernatremia |
| Severe high | ≥ 160 | Severe hypernatremia |
Bands are a common laboratory convention for orientation only; local reference intervals vary, so confirm against your own laboratory. You can verify the underlying method against MDCalc’s sodium correction for hyperglycemia.
Frequently asked questions
What is corrected sodium?
Corrected sodium is an estimate of the true serum sodium concentration after accounting for the dilutional drop caused by high blood glucose. It shows whether a low measured sodium reflects real hyponatremia or just the osmotic water shift from hyperglycemia.
Why is sodium corrected for hyperglycemia?
High glucose draws water from inside cells into the bloodstream, diluting sodium so the measured value reads falsely low. Correcting reveals the underlying sodium status, which is important when assessing DKA and HHS.
Should I use the 1.6 or 2.4 correction factor?
The 1.6 (Katz) factor is the long-standing default and remains widely used. The 2.4 (Hillier) factor is based on measured data and may better reflect the true shift, especially when glucose is above about 400 mg/dL. The calculator shows both so you can see the range; the choice is a matter of clinical judgement and local convention.
Does hyperglycemia cause hyponatremia?
Yes. It causes a true osmotic (translocational/dilutional) hyponatremia: the sodium concentration genuinely falls because water shifts into the blood. As glucose is corrected, sodium typically rises back toward the corrected value.
Is corrected sodium the same as measured sodium?
No. Measured sodium is what the laboratory reports. Corrected sodium adjusts that value upward to estimate what the sodium would be at a normal glucose. The two are equal only when glucose is at or below 100 mg/dL.
How do you calculate corrected sodium for glucose?
Add the correction factor multiplied by the glucose excess in hundreds of mg/dL to the measured sodium. For glucose of 600 mg/dL the excess is 500, so the Katz adjustment is 1.6 × 5 = 8 mEq/L added to the measured sodium.
Educational reference, not medical advice. This page and the corrected sodium calculator are for education and clinical decision support only. They do not diagnose, prescribe, or replace the judgement of a qualified clinician. Every result depends on the values you enter — always confirm sodium and glucose against the original laboratory report, follow your prescriber or care team, and interpret corrected sodium within the full clinical picture.